Scroll down for bigger images and an explanation.
Update: Links in the Huffington Post, SF Gate, Mission Mission, The Tender and Mission Loc@l.
This is part 2 of an analysis of postings reporting stolen bikes on Craigslist. Part 1 is here.
Bike theft sucks. What can we learn about it?
Bike theft sucks. If your bike is stolen, not only will you have lost a fairly significant possession, but there’s a good chance you’ll be stranded or stuck if you use your bike as a mode of transportation. (If you’re looking for tips on how to avoid having your bike stolen, try the San Francisco Bike Coalition’s page on theft prevention.)
I was curious about how bike thefts occur and what kind of patterns there were in bike theft incidents. To do this, I turned to Craigslist, where occasionally while looking through listings for used bikes, I’d stumble upon a post where someone would plead for their bike to be found and returned. Or I’d see a post where someone would promise revenge if the thief is ever found on their bike. So, to get a better idea of what was happening with stolen bikes and Craigslist, I gathered some data.
Gathering and processing data
I archived San Francisco Craigslist listings from July 2nd, 2011 til October 17th, 2011 in the “bicycles” section with “stolen” in the title. This includes listings all over the Bay Area – San Jose, Mountain View, Oakland, Berkeley, San Leandro, Santa Cruz and so on. This is only about 3 months of data, but I think it’s fairly representative.
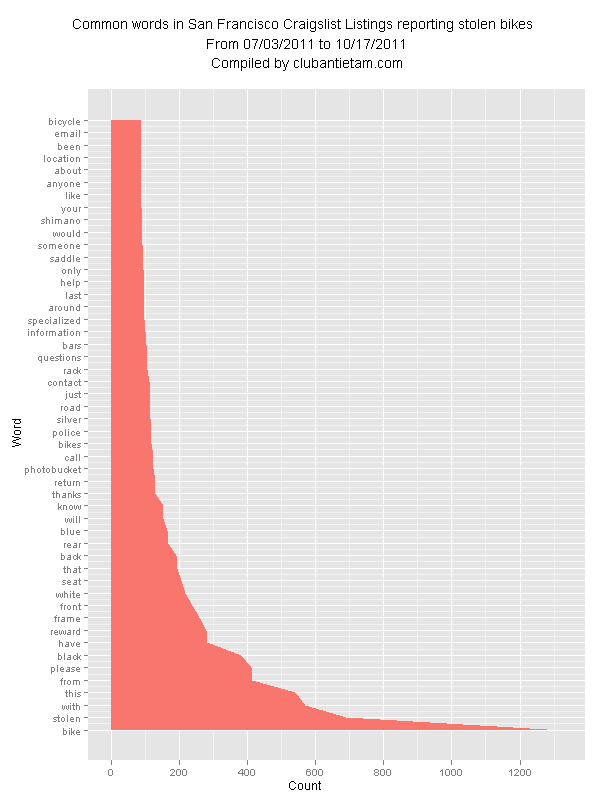
The first part of my analysis was a simple graph with word counts for an aggregate of the postings. It showed that there was a tendency for people to post about bikes (obviously) with pleas for help. Shimano components and Specialized bikes dominated the listings. Black was the most popular color in the posts.
I was also curious about the geographical distribution of stolen bikes. If you were to park your bike somewhere, in which neighborhood is it more likely to be stolen? Which city has more stolen bikes? I took the big group of postings and converted the data format to a spreadsheet and then used software to make a treemap and then manually cleaned up the graphic and tried to make it a little prettier. (If you care for details: I created a Google Reader feed back in July, exported the feed to XML, cleaned up the data and exported to CSV using Google Refine, then used R and the map.market function in the portfolio package to create an image. I then used Adobe Illustrator to make things a bit more attractive and readable. Flowing Data’s “An Easy Way to Make a Treemap” was very helpful in this process. If I had known how to code in R better, I would probably have tried to modify map.market to create a more refined treemap and remove some of the manual steps.)
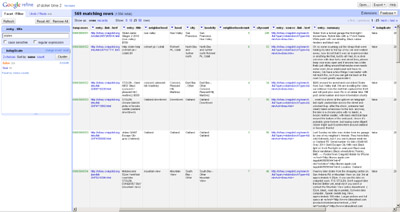 Above: Google Refine converted postings into a tabular format.
I settled on a treemap as a format to display the data, but I think a geographical map would have been the best way to represent the data. I guess I just wasn’t up for tracing neighborhood boundaries and all of the other associated work.
I should also note that going through the listings made me kind of sad. Bike thieves suck.
How good is the data? Can it be refined?
Analyzing Craigslist postings isn’t a perfect way to determine where bikes are stolen. There are a few registries out there that may have some good data. I was curious about Craigslist postings specifically since I had stumbled across so many while shopping around for bikes for myself.
So, for a point of data from Craigslist to show up correctly in this analysis, someone who had their bike stolen would need to:
1) report a missing bike as stolen on Craigslist
2) identify the neighborhood where the bike was stolen in the posting properly
There were 633 postings in total with the word “stolen” in the title. It seems that most people do 2) pretty well. Only about 9% (59 of 633) of the postings did not have an actual location in the title. I don’t know how many people who have had their bikes stolen actually post on Craigslist and report their bikes as stolen. I’m pretty sure it’s not all people.
Duplicates were removed
Some people are really good at posting on Craigslist though. They posted multiple times. This is totally understandable for someone who wants to get their bike back. I used Google Refine to remove these duplicates so that they would not skew the data, but I probably ended up removing some unique posts in the process. All in all, 64/633 were removed because they were duplicates.
“Stolen” is a bike company name
There’s a company that builds BMX bikes that is named “Stolen.” I removed some, but I think about 19/633 made it into the infographics that weren’t actually stolen. In an interesting ironic twist, 1 posting was for a stolen “Stolen” brand BMX bike.
The way people post locations can vary
Since anyone can post almost whatever they want on Craigslist, the data was pretty messy. Craigslist has created a bunch of predefined neighborhoods such as the “Mission District” and “Hayes Valley,” but sometimes people don’t stick to the naming convention. Sometimes people are ambiguous with neighborhood names and post “Mission” instead of the “Mission District.” Some other people are much more specific – they post “Near Mission Cliffs” or a specific intersection like “Stockton and North Point.” For the most part, I didn’t convert these to their applicable neighborhoods unless the poster’s intent was obvious, like with typos, for example.
Some people did not include a location or included not very useful but understandably frustrated-sounding “locations” such as, “you tell me” and “can you find it?” Other locations contained text like, “United States” and “The Bay Area.” I grouped these ambiguous “locations” into their own category. They are still included in the infographics below.
Also, some listings contained locations covered by other local Craigslist websites. “Sacramento,” for example, has its own Craigslist page, but a posting was still filed under the San Francisco Bay Area Craigslist page.
Good Samaritans also post
There were some postings from people who saw or purchased possibly stolen bikes and were trying to reunite them with their owner. (The Laney College Flea Market in Oakland is a good place to find your bike if it’s been stolen, by the way.) This is good for the world, but it clouded the data set just a little bit. I don’t know exactly how many postings were of this type but it was not too large of a number. I’d estimate about 5% of postings were from good Samaritans.
Where does bike theft occur?
So, with all of that out of the way, here are the infographics with treemaps. The size of a rectangle is proportional to the number of occurrences for that location. Larger rectangles mean more bikes were reported as stolen, and smaller rectangles mean the opposite.
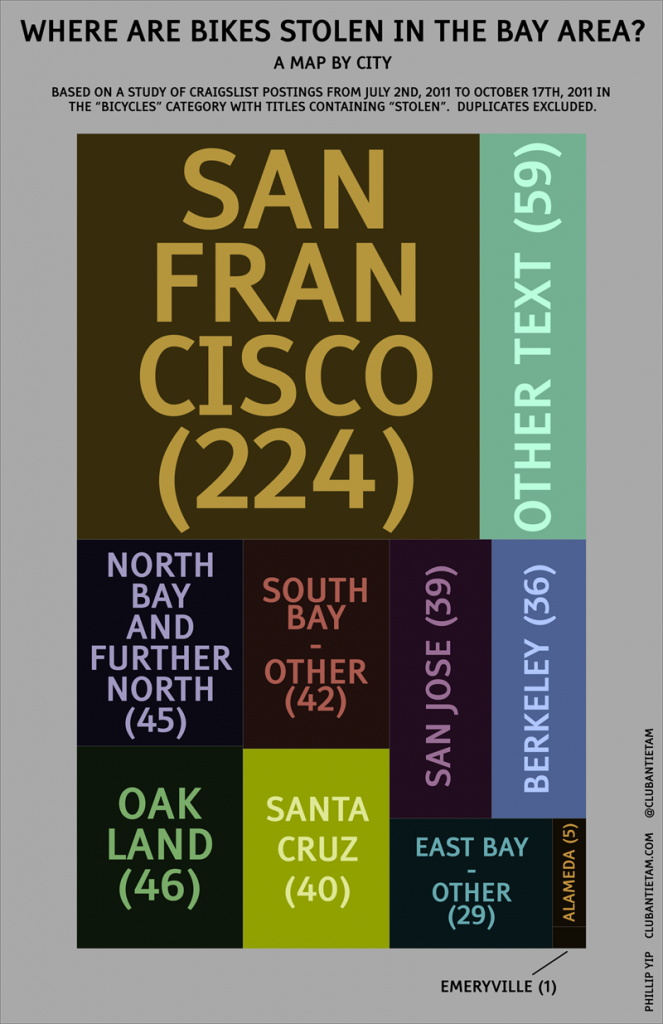
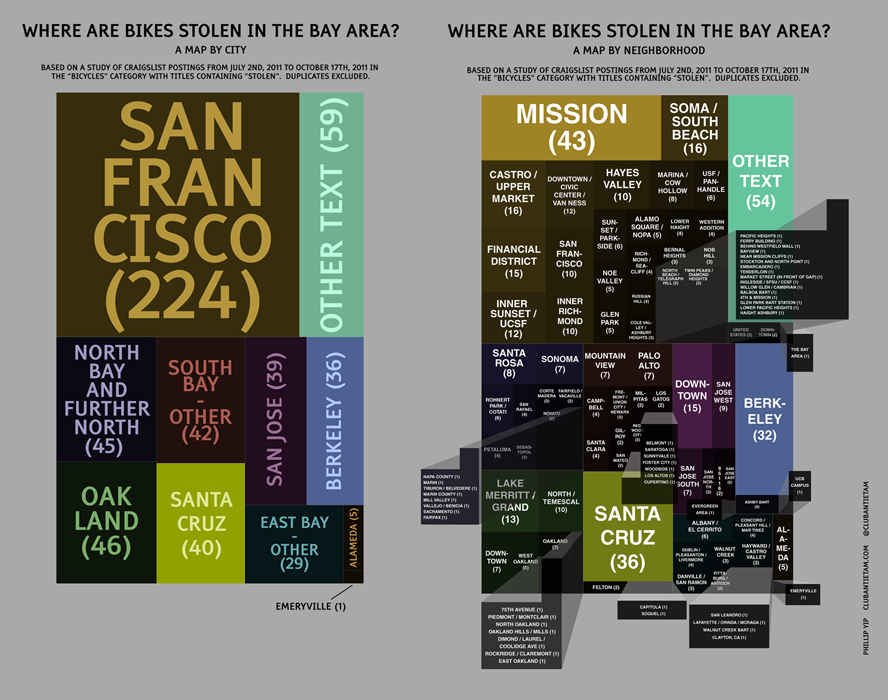
The first infographic is a treemap, with postings separated by city:

Interestingly, nearly half of the stolen bike postings were from San Francisco. I expected to see more theft in Oakland and Berkeley. It’s also surprising that there was only 1 reported theft in Emeryville. Is it because Emeryville is that much smaller? Are there not many cyclists there?
Workflow note: I made this treemap manually in Illustrator based on the neighborhood map below. Open the image in a new window to view at full resolution.
Which neighborhoods?
This second infographic is also a treemap, but with areas divided by cities and neighborhoods. You’ll notice that they are color coded with the same hue as in the above city infographic.
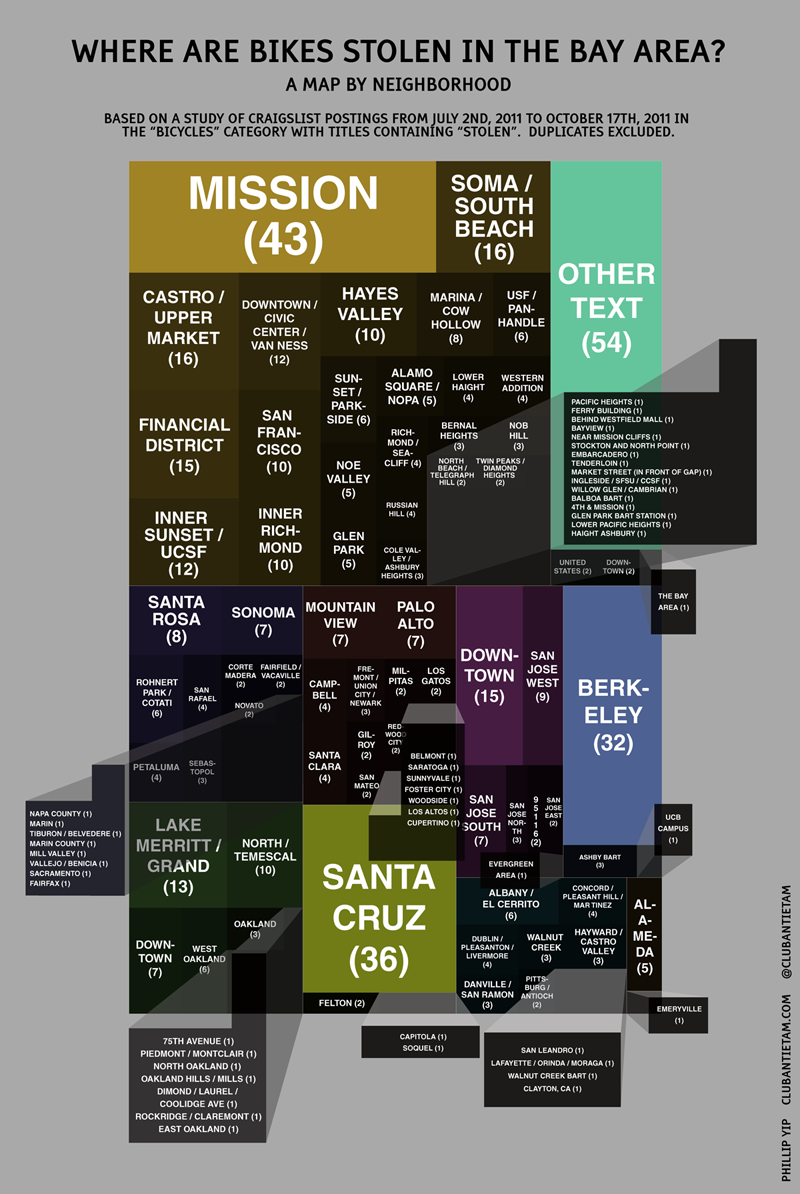
Holy crap, there are a lot of neighborhoods. The Mission district wins for being the neighborhood with the most stolen bike listings. In Oakland, the largest chunk of thefts occurred by the Lake. There’s a pretty large number of stolen bikes in Santa Cruz and Berkeley, probably due to high bike usage by college students and perhaps naïveté with regards to bike locking strategies. Strangely, there aren’t a lot of listings from Palo Alto or Stanford. Is there less theft there or do people just not look to Craigslist when trying to recover their bike?
What’s next?
I like how they turned out, but making these damned infographics took a lot of time. I think there’s still some interesting stuff to get out of the dataset. I’m curious about how bikes are stolen. Did somebody cut through a lock? Did they break into an apartment? Did somebody just lean their bike and then look away for a few seconds? I’ll try to find that out next.
– Phillip Yip

 nice interior with natural light